Note
When deploying the Telescope and Site systems for the main telescope at NCSA we started to experience severe startup slow downs of up to 1 minute (the timeout in waiting for DDS initialization) when starting up components. These occurrences affected components both using SalObj and SAL (e.g. CCCamera) and manifested mainly by timeout’s in getting historical data followed by the communication being seriously unstable.
With the deployment of a new cycle (with xml 6.1) we decided to take closer look at the problem. This tech-note describes the findings, proposed solutions, and points of concern for the future deployment.
These tests occurred initially in the week of July 20-24, 2020, and further enhanced by a second campaign in August and September of 2020.
1 Introduction
Up until early 2020, practically all system deployment, integration and on-sky operations were conducted with the Auxiliary Telescope (AT) components. Some limited and isolated testing with the Main Telescope (MT) components were performed at the summit and local developers environment. On these occasions the DDS communication mostly worked as expected, with some occasional failures or unreliable message exchanges occurred, but nothing that would prevent users from operating the system.
Nevertheless, with the onset of more intensive testing with the MT components (initially at NCSA test stand and then at the base facility) we started to experience routine severe system failures. These failures would mostly manifest once a sufficiently large number of high data rate components, components with a large number of topics or that subscribes to topics from several other components (e.g. MTM1M3 and MTMount) were brought up in the system. Initially, they were observed mainly by users trying to run control sequences from Jupyter notebooks in nublado, though it was soon realized that the problem affected all other components in the system (salkafka producers, CSCs running SAL and SalObj).
In the following, we present some details of the history and experience accumulated over time with DDS, results of the investigation conducted at NCSA test stand about this new failure mode and the proposed solution.
2 Overview
The test started by using the OpenSplice standard deployment, which employs the DDS single process mode. This mode of operation has been used with the Vera Rubin Observatory system from the beginning and, despite some occasional issues, worked relatively well over time. In fact, most of the time we encountered issues with the DDS communication we could relate them to one of the following issues:
Incorrect DDS partition.
The DDS partition is controlled by SAL and SalObj by the
LSST_DDS_DOMAINsystem environment variable. It was common on some occasions that users would set different values for that variable, which causes DDS to filter the messages and communication would not work.Diagnostics consists of making sure the environment variable is correctly set. In most cases this would involve login to the machine running the service and printing the variable. e.g.;
printenv LSST_DDS_DOMAINThe solution is to make sure everyone on the system has the same values for the environment variable.
Systems running incompatible versions of xml interface.
The xml interface determines the DDS topics data structure. If topics with the same identity have different data structures the last system to try to connect to the DDS network will fail. This created several issues in the past as DDS cache would prevent users from upgrading the topic data structure. A mitigation to this problem was introduced in recent versions of SAL in which a hash code based on topics content was appended to its name. This allowed users to upgrade topics without colliding with previous cached versions but also meant that incompatible versions silently fail to communicate.
Diagnosing this issue mainly requires developers to confirm the deployed version of the libraries, and vary considerably from sub-system to sub-system.
Systems running with incompatible versions of SAL/SalObj.
SAL and SalObj are responsible for managing topics Quality of Service (QoS) parameters. The system defines 4 different types of QoS depending on the “type” of topic: Command, Event, Telemetry and Acknowledgement. Topics with different QoS may sometimes be filtered out by the DDS reader so, an incompatible version of SAL/SalObj may not be able to exchange some messages. This was improved considerably in more recent versions of SAL/SalObj and we have been able to keep breakages to a minimum, especially by rigidly managing deployments.
Diagnosing this issue also requires manually confirming the version of the deployed libraries.
Wrong network attached.
By default the OpenSplice configuration will automatically select a network to attach to. It mainly works by selecting the first suitable network (excluding local and loopback networks for instance) in alphabetical order. For servers with more than one “suitable network” it may happen that the selected network is not the correct one. In this case, users must edit the configuration file and explicitly specify which network to use for the DDS communication.
The first step in diagnosing this problem is to verify the
ospl.xmlconfiguration file (e.g. see 7.2 Standard OpenSplice Configuration). The session,DDSI2Service > General > NetworkInterfaceAddressof the xml file specifies the network for the DDS communication. The default value isAUTOand it should otherwise specify a network name or IP address.If configured in
AUTOmode then the selected network will be logged in theospl-info.logfile created by the process. Inspecting the file you should see something like this:======================================================================================== Report : WARNING Date : 2020-08-04T22:39:02+0000 Description : using network interface eth0 (10.32.10.140) selected arbitrarily from: eth0, net1 Node : nb-tribeiro-w-2020-30 Process : python3.7 <4025> Thread : ddsi2 7f5495cc5700 Internals : 6.9.190925OSS///ddsi2/q_nwif.c/989/0/1596580769.009714659/0 ========================================================================================As it is possible to see in the “Description” field above, the selected interface was
eth0, whereas the user was most likely interested in connecting tonet1.If, on the other hand, the configuration is explicitly selecting a network, one must make sure that it is the correct network. This will most likely require confirmation with IT or other knowledgeable party.
To check the available network interfaces one can usually use the linux
ipcommand:ip addr
As we started to operate the system with an increased number of components, and especially, components with large sets of topics published at higher frequencies (20 to 50 Hz, as opposed to 1Hz) we started to observe a new failure mode. The historical read timeout (henceforth HRTO) failure, seemed to happened at random and is mostly characterized by long or timeouts in reading historical data followed by unreliable DDS communication. The timeout is controlled by an environment variable set at deployment time and was set between 60 to 300 seconds, depending on the component. When the failure mode was in effect, components (CSCs and salkafka producers alike) would timeout during initialization. Users trying to interact with the system using the nublado Jupyter notebook server would also experience the timeout (which was initially set to 300s and later changed to 60s), followed by messages on the console informing of the failure to read historical data.
It is important to emphasize that reading historical data is a standard DDS procedure and consists of synchronizing the internal DDS read queues with all the other components in the system. The communication is actually established before this synchronization occurs and it is even possible to receive newly published data before it finishes. Nevertheless, historical data (for previously published Events) will not be available until the operation is completed. Note that in SAL v4 and SalObj v5, commands and command acknowledgements topics are configured with volatile QoS durability, which means that no historical data is available.
3 DDS Communication Architecture
Before describing the tests performed at NCSA, it is important to have an understanding of how OpenSplice DDS communication works. Basically, the communication is broken down into a set of services, that are in charge of a particular aspect of the process. These services are highly configurable and it is even possible to run the the system with only a subset of them.
These are the OpenSplice DDS communication services:
- networking - providing QoS-driven real-time networking based on multiple reliable multicast channels
- durability - providing fault-tolerant storage for both real-time state data as well as persistent settings
- remote control and monitoring SOAP service - providing remote web-based access using the SOAP protocol from various Vortex OpenSplice tools
- dbms service - providing a connection between the real-time and the enterprise domain by bridging data from DDS to DBMS and vice versa
By default only the networking and durability services are configured.
Furthermore, OpenSplice DDS can be configured to run in two modes of operation, single process or shared memory. When running in single process mode, the configured DDS services will run in the same process as the application. That means, alongside the resources needed by the application itself to run (computing, memory allocation, etc) there will also be additional resources needed by the DDS services themselves. How those additional resources are handled by the application and the programming language itself may have a considerable impact on the system responsiveness and reliability. For instance, Python does not easily support multiprocessing, so DDS services will be competing for the same computing resources as those needed by the application to run properly.
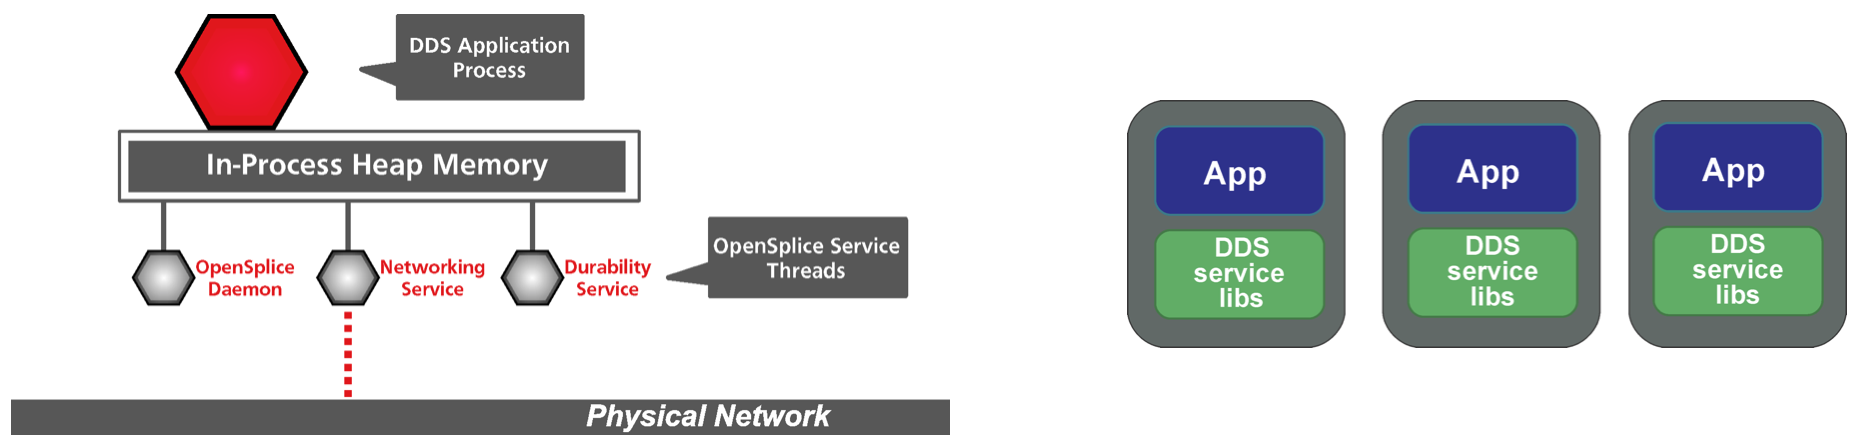
Figure 1 DDS architecture when running in single process mode. In the left hand panel, a diagram showing the internal architecture of a single application. The “DDS Application Process” represents the software developed on top of SAL/SalObj to communicate over DDS and execute some operation. In the case of Rubin Observatory system this would be a CSC, salkafka producer, user notebook server, etc. In the right hand panel, a high level overview of a group of applications (CSCs, salkafka producers, etc). Each application runs their own DDS services alongside their processes.
As one can imagine, the single process architecture does not scale well for large scale systems. If the DDS communication grows large enough (in terms of number of topics and published frequency) the processing requirements for the DDS services alone may start to interfere with the application and vice-versa. To overcome this problem, OpenSplice DDS can be configured to run in shared memory mode, which is, in fact, recommended by ADLink for operating large scale systems.
When running in shared memory mode, the user configures and runs a single daemon per node that is dedicated to running the OpenSplice services. Applications running in the same node can then be configured to attach to the daemon using system shared memory. In this case, several applications share the same DDS services. The computing resources needed by the DDS services are separated from those of the application and will not interfere with each other (assuming the node has enough resources available).
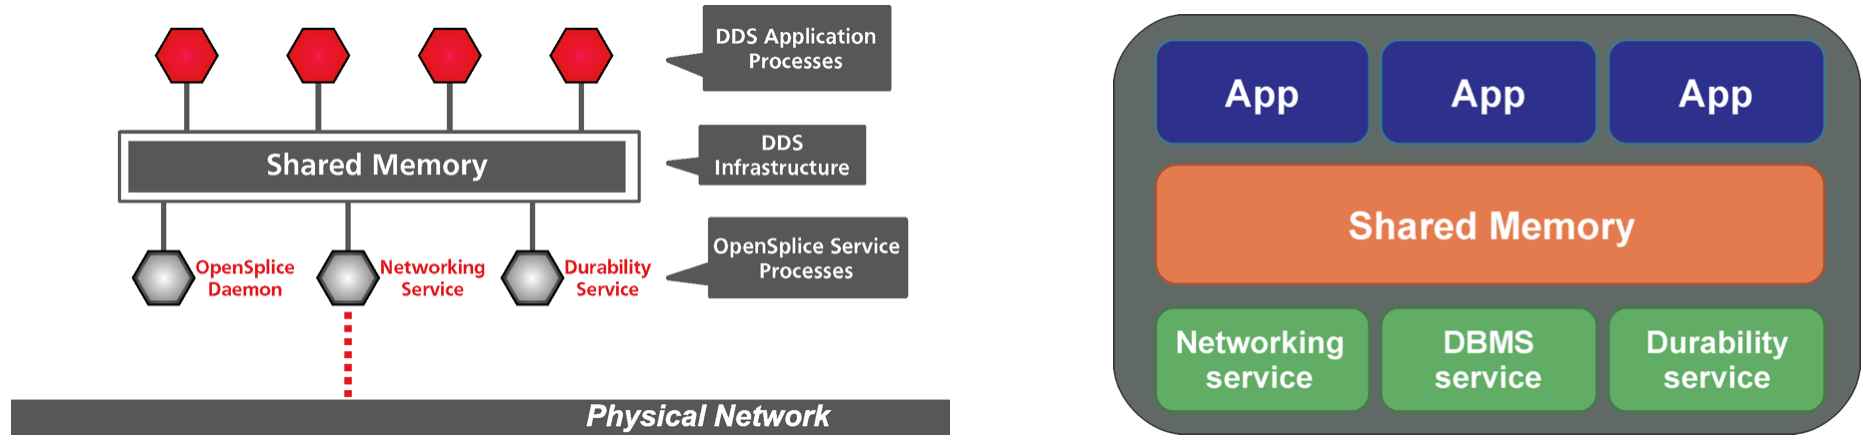
Figure 2 DDS architecture when running in shared memory mode. In the left hand panel, a diagram showing the internal architecture of several applications (denoted “DDS Application Processes”) running concurrently in the same node. All applications share the same OpenSplice DDS services through the shared memory space. In the right hand panel, a high level overview of a group of applications running in the same node (CSCs, salkafka producers, etc) sharing the OpenSplice DDS services.
3.1 DDS Domain and DDS Partitions
DDS provides two different ways to isolate (or organize) topics; domain and partitions.
A DDS domain is a logical network of applications. For applications to communicate using DDS they must participate in the same domain. Components in different domains are completely isolated from each other. For instance, applications running on different domains can have incompatible versions of the same topic on the same network without interfering with each other.
DDS partitions, on the other hand, provides a way of organizing topics on the same domain into different groups. The topics are still all part of the same network so all readers and writers on the system must have compatible versions of the topics. Nevertheless, if a particular reader would/should never read data from a particular writer, they can be isolated by making sure they are on different partitions. The DDS network service still receives the data, which is then filtered out and not made available to the upstream services.
For instance, imagine a system composed of two applications; one that publishes telemetry and subscribes to commands and another that subscribes to telemetry and publishes commands. The first application would never read telemetry, only publishes it. At the same time, the second application would never read commands, only publishes it.
If all the data is written in the same partition, it means the data reader on both applications receives and must handle both telemetry and commands, see left-hand panel on Figure 3. On the other hand, if telemetry and commands are placed in two different partitions, the data reader from the first component (that publishes telemetry) would not receive the data the component itself publish (right-hand panel on Figure 3). Overall, this feature allows DDS to optimize the data transfer between readers and writers minimizing the load on applications and daemons.
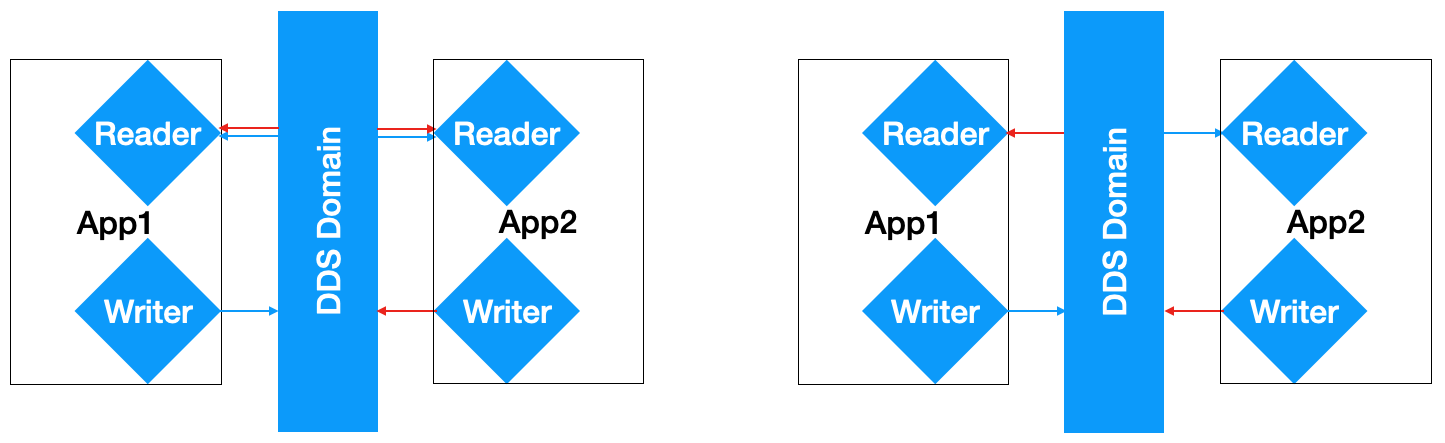
Figure 3 Illustration of how DDS data partitioning works. Following the discussion in the text, blue arrows represent telemetry data and red arrows commands. On the left hand panel, all data is written to the same partition and therefore, received by all data readers. On the right hand panel data is partitioned so that the reader of the component that writes the data does not receive it back.
4 NCSA Standard Deployment Test
This test consisted of trying to reproduce the HRTO failure mode observed in multiple occasions at the NCSA test stand when running the MT components. For that, we wanted to make sure we started with a fresh system and also deployed all the components with the standard OpenSplice configuration.
All SAL components were brought down so that there was no DDS traffic to start with. This was verified using the OpenSplice tools, that allow us to listen for any DDS traffic on the network, and with network traffic analysis tools (e.g. tcpdump and etherape). Since the OpenSplice tools also create DDS traffic, we made sure to switch it off and check the network for traffic again (with tcpdump and etherape) before starting the deployment of the system.
With the system clear, we started deploying the Telescope and Site components one by one. We started with the CSCs, going from the lighter to heavier components, while leaving the salkafka producers off. After each component was deployed, we inspected the network topology (the network connections stablished between the components) and traffic. Furthermore we also verified the integrity of the system by starting remotes for each deployed component and verifying that they could read historical data and that communication was operational. We verified a steady increase in network activity after each component was brought up and increasing spikes in network traffic during startup.
Once the last component was brought up we observed a spike of around 11Mbps followed by a steady network traffic of around 3.5Mbps, with all components still in STANDBY state (only publishing heartbeats).
At this point it was verified that communication problems manifest when trying to initialize remotes for the MT components.
A network topology diagram, showing the established DDS connectivity between the components, was constructed for the system at this state.
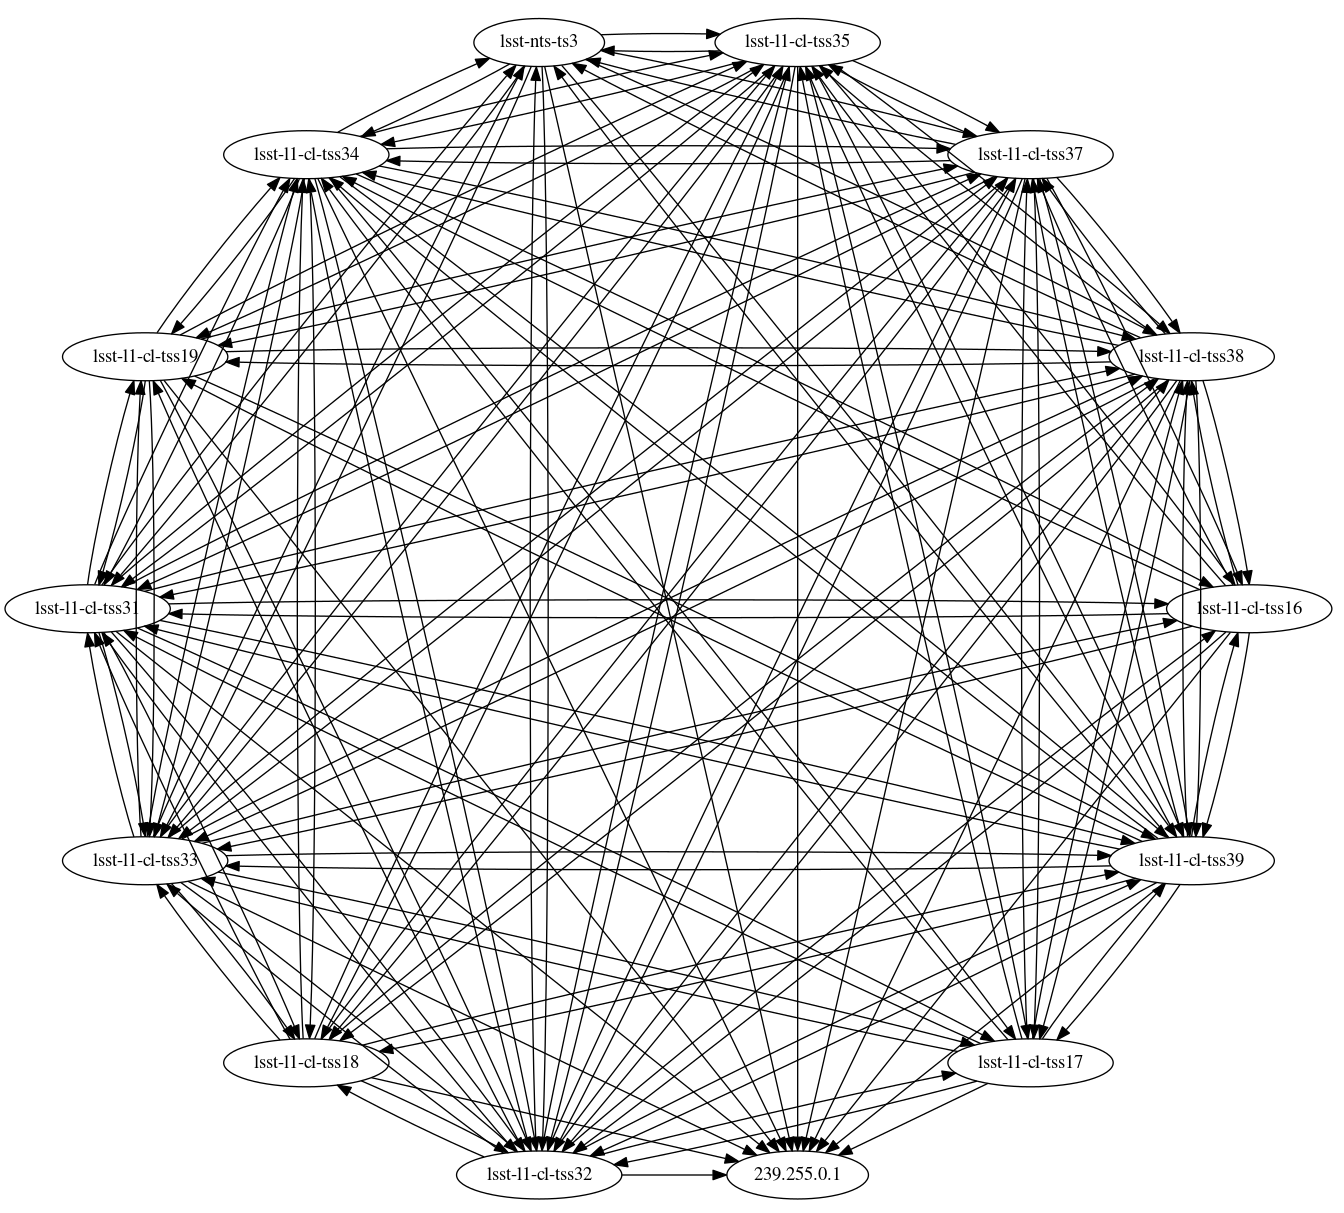
Figure 4 Network connectivity diagram for the full system running with DDS single process mode at NCSA. Each ellipse on the diagram represents a component on the system. The text inside the ellipses are the hostname or the IP address of the component, see text and Table 1 for more information. Arrows indicate the network traffic direction.
Note that, although each CSC/service has their own IP address, in fact, they are all being deployed as docker containers from two different host nodes. The deployment strategy uses docker macvlan network driver to give each container it’s own IP address, overlaid on a bridge network. This solution proved to be more reliable than use the host network driver option, commonly used in these situations. It also proved to be a good strategy when deploying systems on Kubernetes clusters.
| Service type | Hostname | IP address | Information |
|---|---|---|---|
| ospl tool | lsst-nts-ts3 | 141.142.238.252 | |
| salkafka | lsst-l1-cl-tss16 | 141.142.238.115 |
|
| ospl daemon | lsst-l1-cl-tss11 | 141.142.238.110 | Only running in shared memory mode. |
| salkafka | lsst-l1-cl-tss17 | 141.142.238.116 |
|
| salkafka | lsst-l1-cl-tss18 | 141.142.238.117 |
|
| salkafka | lsst-l1-cl-tss19 | 141.142.238.118 |
|
| ospl daemon | lsst-l1-cl-tss30 | 141.142.238.129 | Only running in shared memory mode. |
| CSC | lsst-l1-cl-tss32 | 141.142.238.131 |
|
| CSC | lsst-l1-cl-tss33 | 141.142.238.132 |
|
| CSC | lsst-l1-cl-tss34 | 141.142.238.133 |
|
| CSC | lsst-l1-cl-tss35 | 141.142.238.134 |
|
| CSC | lsst-l1-cl-tss36 | 141.142.238.135 |
|
| CSC | lsst-l1-cl-tss37 | 141.142.238.136 |
|
| CSC | lsst-l1-cl-tss38 | 141.142.238.137 |
|
Although not all components subscribes to each other topics, the network topology diagram displays an extremely high inter-connectivity between all the different components/hosts.
To begin with, note the IP address 239.255.0.1 in the diagram, which is the multicast address utilized by traffic from all the components.
A more close look into the diagram show that there are two distinct behaviors, related to the two different types of services deployed; CSCs and salkafka producers.
CSCs will send and receive DDS traffic to all other components of the system, whereas salkafka producers will send and receive traffic from CSCs only.
This is more easily seen by filtering all the inbound and outbound traffic to one of the CSCs and to one of the salkafka producers individually.
Diagrams with the traffic to the MT pointing component (MTPtg, hostname lsst-l1-cl-tss31) and to the salkafka producer for the AT components (hostname lsst-l1-cl-tss16) are shown in the left and right hand side of Figure 5, respectively.
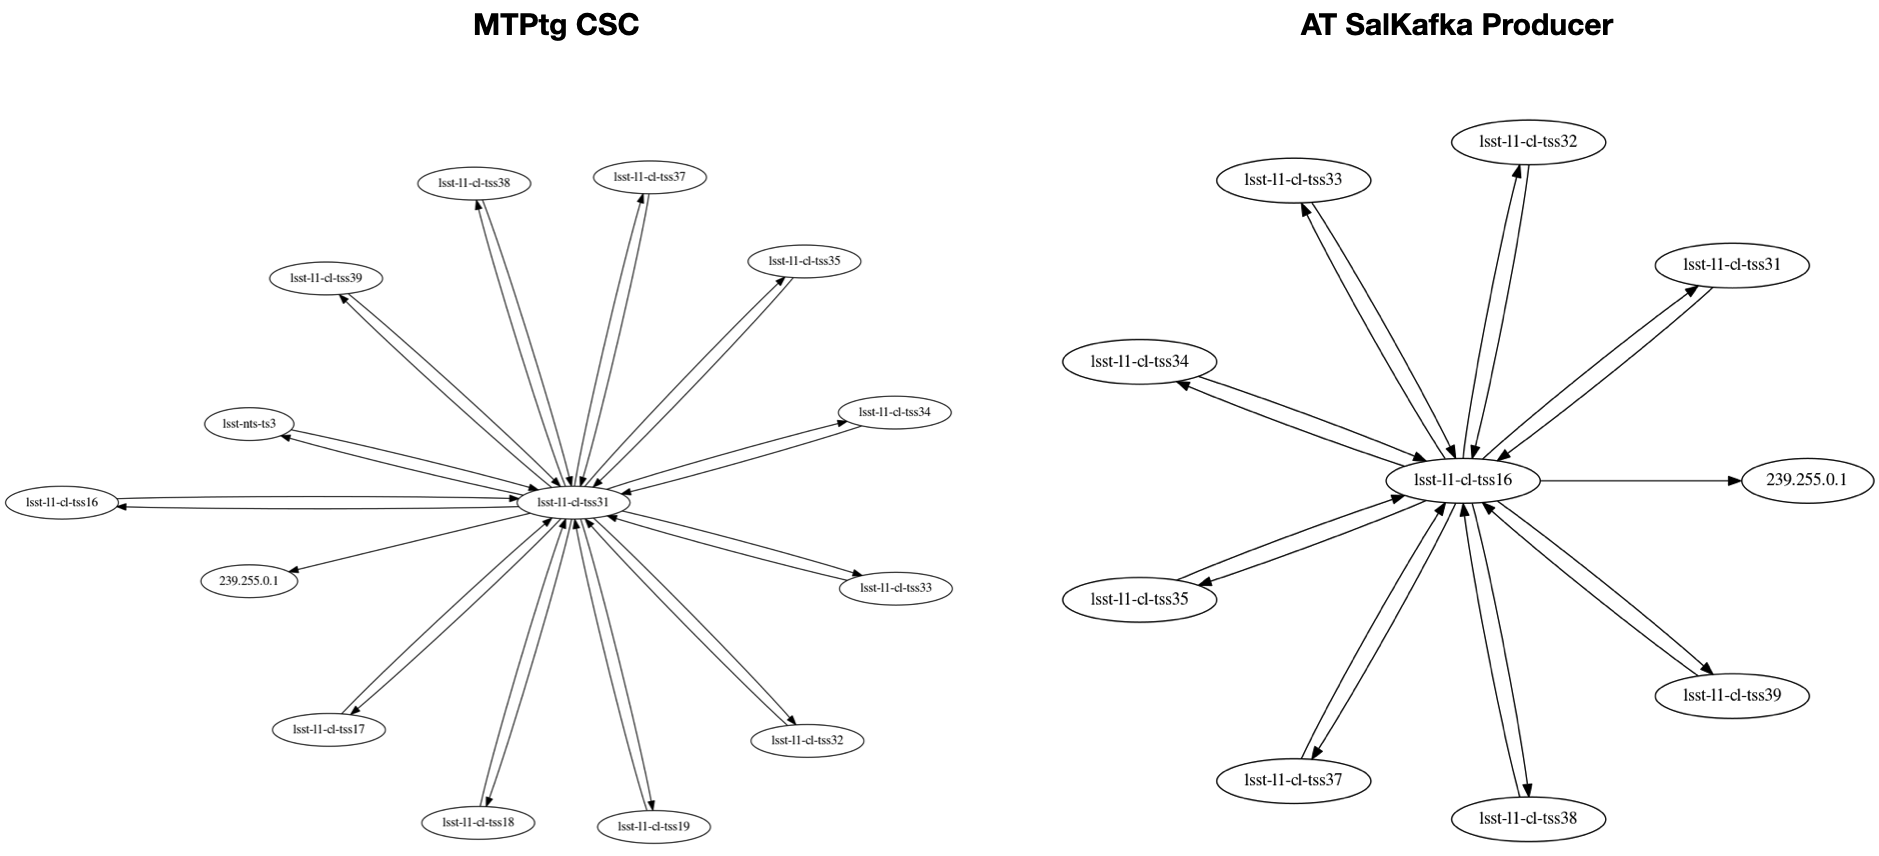
Figure 5 Filtered network connectivity to the MTPtg CSC (left hand side, hostname lsst-l1-cl-tss31) and to the salkafka producer for AT components (right hand side, hostname lsst-l1-cl-tss16).
One of the reasons we selected the salkafka producer (lsst-l1-cl-tss16) for the diagram in Figure 5, is that it does not subscribe to any of the CSCs running on the system at that time.
Still, the component is receiving DDS traffic for all the CSCs.
At the same time, the MTPtg is a component that no other CSC currently subscribe to events or telemetry from. This is one of the main actor component of the system and it operates mainly by sending commands to other CSCs (MTMount and Rotator). Still, this CSC sends and receives DDS traffic from all the other CSCs, in addition to all salkafka producers in the system.
To understand this behavior we have to look at the how the DDS Communication works when operating in single process mode. As explained in 3 DDS Communication Architecture, each component running in single process mode will also run a full set of DDS services. By design, these services will be processing not only the data required by the application itself but also in the full topic set present in the system at any moment. This explains the extremely high inter-connectivity observed in Figure 4 and also why upcoming components would lag behind in trying to keep up with the system traffic.
Therefore, following the OpenSplice deployment guidelines on how to deal with large scale systems, we proceeded to experiment with OpenSplice shared memory mode.
5 NCSA Shared Memory Test
The first step in testing shared memory mode was to rebuild all the components using the licensed version of the OpenSplice, since the community edition does not support this mode of operation. This required some refactoring of the build scripts since the licensed version is stored in a password-protected private repository, and we also want to be able to build both licensed and community editions. Furthermore, we also have to provide the ospl daemon to run the OpenSplice service.
Since all the services run from a docker containers, the daemon was also deployed on a container. To make sure the system would work properly we had to enable two additional features when running the containers:
ipc=host, to allow containers to access the host machine shared memory space and,pid=host, to allow containers to share the process id with the host machine.
In addition the container must also share a common /tmp folder with read and write access to all users and groups.
This is required so containers can access a socket and a lock file created by the ospl daemon and needed for the shared memory process to work.
Finally, shared memory is activated by use of a specific ospl configuration, which must be the same for the daemons and applications.
Once all the components were updated to the licensed version of OpenSplice with the new configuration and the daemons were ready, they were deployed into a fresh system (see 4 NCSA Standard Deployment Test for details). The daemons must be deployed first, so that the OpenSplice DDS services become available. Next we brought up all the CSCs, one by one, and salkafka producers following the same process of the standard configuration test, measuring the network traffic as each new component was initialized.
This time we did not observe issues when trying to bring the producers up after all CSCs were running. We also did not observed any issues trying to start remotes to communicate with the CSCs, when also using the shared memory mode. However, we did observe the HRTO issue if we try to initialize a remote without using the shared memory mode.
As expected, the network topology now shows that only the ospl daemons (lsst-l1-cl-tss11 and lsst-l1-cl-tss30) are communicating with each other, since they are in charge of the OpenSplice DDS services.
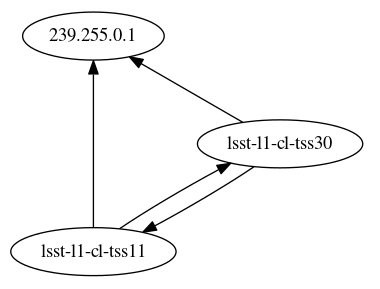
Figure 6 Network topology for the full system in shared memory mode. Even though all components are running, only the OpenSplice daemons communicate with each other over the network.
Overall the preliminary results indicated that using the OpenSplice shared memory mode helps solve the issues we observed previously with a large scale system.
Furthermore, the preliminary tests involved mainly the MT components running on two different nodes. The next step was to experiment with an even larger scale system, on an environment that more closely resemble the production environment. We then proceeded to deploy both MT and AT components alongside some OCS components (e.g. ScriptQueue and Watcher) on a Kubernetes cluster with several nodes, and some components (LOVE, MTM1M3 and MTM2) on bare metal machines. Details on the Kubernetes deployment are available here.
One important feature we noticed from the beginning of the tests with Kubernetes nodes is that the OpenSplice daemons are highly sensitive to shutdown procedures.
Applications attached to the daemons must not be forcibly terminated or they risk corrupting the daemons shared memory, ultimately affecting all applications attached to it.
To prevent this from happening applications should either shutdown gracefully which, in case of most CSCs, means exiting when commanded to OFFLINE state, or be terminated with a SIGTERM signal.
Terminating an application attached to a daemon with any other signal than SIGTERM (e.g. SIGINT, SIGKILL, etc) will cause the corruption problem.
In order to prevent this from happening in the Kubernetes deployment we had to implement additional features in the container startup procedure, to make sure termination signals (sent by Kubernetes) are properly propagated and to wait until the running application exits.
Furthermore, attempts to deploy the full observatory system with the same daemon configuration used for the initial tests on the Kubernetes cluster at NCSA resulted in a highly unstable system. For instance, attempts to bring all salkafka producers up at the same time would sometimes cause daemons to fail and, sometimes, crash. On other occasions, it was possible to start one producer at a time but the final set of producers would experience the HRTO problem we saw before. On occasions where it was possible to standup the system successfully it would run for a certain number of hours and then one of the daemons would fail and terminate, killing all the components that were connected to it. The most common problem we noticed was that the daemon M1M3 component was attached to would fail, causing the component to crash.
Investigating the log generated by the daemons, we concluded that once we transitioned to deploying an even larger system than before, the daemons themselves started to run out of resources.
DDS contains some builtin topics used by the middleware system for self configuration and bookkeeping.
When the problems started to manifest the daemons would log messages of missing heartbeats (this is the DDS internal heartbeat, used to determine the presence of a domain participant) and other missing builtin topics (e.g. d_sampleChain), thus indicating that the daemons were having problems keeping up with the load;
========================================================================================
Report      : INFO
Date        : 2020-09-03T17:19:02+0000
Description : Missed heartbeat for node 105060556. (DCPSPublication is complete)
Node        : ospl-daemon-m482p
Process     : spliced <148347>
Thread      : OSPL Garbage Collector 7f48013ae700
Internals   : P674/6.10.4/de6011b/2a9a655/v_spliced/v_spliced.c/2034/769/1599153542.755942957/2
========================================================================================
Report      : WARNING
Date        : 2020-09-03T17:40:49+0000
Description : writer 6672e859:7b:1:a02 topic d_sampleChain waiting on high watermark due to reader 4254ba5d:7f:1:1507
Node        : ospl-daemon-m482p
Process     : ddsi2 <148361>
Thread      : xmit.user 7f20e331b700
Internals   : P674/6.10.4/de6011b/2a9a655/ddsi2/q_transmit.c/923/0/1599154849.155224251/2
========================================================================================
In order to solve this issue, it required some further understanding of how DDS communication works and more study on the daemon configuration. The goal was to be able to increase the resources available for the OpenSplice daemons to handle the increased load while also reducing the load on the DDS services.
5.1 Increasing OpenSplice daemon resources
The OpenSplice DDS software configuration provides several different ways of increasing the computing resources available for the daemons, mostly revolving around the memory allocation limits. Considering that the initial configuration for the daemons allocated 10 times as much shared memory space then the standard, we also increased by 10 times the amount of memory available for other daemon services.
In addition to increasing resources for the daemons we also enabled two new features that helps reduce system load; squash participants and lazy alignment.
The squash participant feature allow daemons to “merge” the data structure of all the applications attached to it into a single data structure. Therefore, instead of presenting several “participants” to the network, the daemon presents a single unified system that is much leaner to maintain. This feature not only helps reduce the data structure complexity but it also reduces discovery time for new components in the system. The drawback to squashing participants is that we lose the ability to inspect individual applications data structure. For instance, in the default operation mode, it is possible to use OpenSplice tools to list the applications attached to a daemon, inspect which topics the application subscribes to and what is the state of the application readers and writers.
By default, when an application creates a DDS domain participant and joins a partition namespace, DDS allocates resources and starts making data on the partition available to it right away. This happens even if the application does not create a data reader for a topic in that partition. Although this feature helps reduce subscription times and also increase data recovery, it comes at the expense of resources from the application or the daemon it is attached to. In general, we are not relying on DDS history capability to store component data in case of a system crash, which means we have limited use for the default behavior. In order to allow for a leaner daemon the configuration was changed to use “lazy alignment”. With this feature, the readers will only receive and store data that is requested by the applications or, in case of the daemons, application that are attached to them.
The final configuration we arrived at after extensive testing with the system can be seen in 7.1 Final Shared Memory OpenSplice Configuration.
5.2 Implementing a new DDS data partitioning schema
It is important to note that the configuration discussed in 5.1 Increasing OpenSplice daemon resources affect only the daemons and not those processes that will still rely on single process mode. In order to allow these processes to still run reliably, and also in an attempt to require less resources from the daemons, a new DDS data partitioning schema was implemented.
As explained in 3.1 DDS Domain and DDS Partitions this feature allows the DDS domain to filter out topics for readers that join the domain in a particular partition. To take advantage of this feature without increasing the scope of system configuration complexity, we decided to adopt two different partitions for each component of the system; one partition exclusively for commands and a second one for telemetry, events and acknowledgements. This configuration allows us to maximize the segmentation of the system while minimizing the computing resources required by components.
The motivation for this partitioning scheme derives mainly from the system architecture. The system architecture specify mainly two component types; Controllers and Remotes, in SalObj nomenclature. Controllers are the base components upon which CSCs are created. They mainly consist of applications that read commands and write telemetry, events and acknowledgements. At the same time, to communicate with a CSC one would use a Remote, which writes commands and reads telemetry, events and acknowledgements.
By allowing a separate partition for read and write operations, components can share most of the resources needed to communicate in both directions while still minimizing data duplication (as shown in Figure 3). One could argue that there could be a partition for each individual topic of the system, which would allow readers to only receive the data they are actually requesting. The reason for avoiding such thin partitioning is that it would require substantial resource duplication. For instance, DDS allows applications to share substantial resources when creating readers and writers on the same partition. At the same time, the software architecture allows us to safely share most of those resources for an individual component so, splitting the topics for a component into more partitions means there would be less shared resources.
Details on how this is implemented can be found in SalObj documentation.
5.3 Quality of Service configuration
Quality of Service (QoS) is a topic-specific configuration that controls many aspects of how information is handled by DDS, including how reliably messages are exchanged and if a topic has historical data (for late joiners). Our architecture specifies QoS configuration based on the message type, e.g., commands, events, telemetry and command acknowledgements.
Up to SAL v4 and SalObj v5 the QoS was partially stored in a QoS file and partially hard coded into the software code base. This created issues, specially when changes to QoS were needed, which required full rebuild of the system. As of SAL v5 and SalObj v6 QoS is fully specified by a file stored in the ts_idl repository. This new QoS file has named profiles for each topic category: commands, events, telemetry, command acknowledgement.
As part of this exercise we adopted a couple changes in the previous QoS settings.
The most important change to be noted is that now Telemetry topics have durability set to VOLATILE, which means the system will no longer store historical data.
Since telemetry is continuously published at a set frequency by CSCs, storing historical data gives little to no benefit while imposes an additional load on the DDS systems.
From now on, events are the only kind of topics that offer historical data.
They are configured with TRANSIENT durability, which retains historical data as long as the application that published the data is still running (and have not explicitly disposed the data).
It is also worth noting that TRANSIENT durability causes the historical data to be stored in memory by all running durability services.
Ultimately, that means all daemons and applications running in single process mode that are configured with a durability service (the default configuration) end up storing copies of event topics.
An alternative possibility would be to use TRANSIENT_LOCAL durability which would cause the historical data to be stored only by the durability service of the application that published the data.
Although this configuration seemed like a better alternative to reduce the load on the daemons, our tests showed that it resulted in less reliable communication, with overall longer historical read times and occasional HRTO.
5.4 DDS Master
When deploying several applications in different nodes (also called federations), DDS will select a node to serve as the master of the system. The master is in charge of keeping a dictionary of all the topics in the system and its durability service will work as the source of historical data for new applications. In a sense, the master node acts like a broker for historical data.
The process of selecting a master for the system is handled by DDS using the masterPriority for each application, which is configured via NameSpaces/Policy/masterPriority entry in the ospl configuration file.
The selection process is explained in the master priority section of the ospl deployment guide.
Basically, the system with the highest value of masterPriority is selected as the master.
If all nodes have the same masterPriority, then the one with the highest namespace quality (measured by DDS) is selected and, if a tie still exists, the system with highest ID is selected.
- Some important notes to keep in mind:
- In order to use the master priority selection algorithm, the value of
masterPrioritymust be between 0 and 254. - If
masterPriority=255(the default), the selection process falls back to the legacy mode, which is not recommended. - If
masterPriority=0, then that node will never become master.
- In order to use the master priority selection algorithm, the value of
To control the masterPriority we introduced the OSPL_MASTER_PRIORITY environment variable in the ospl configuration file.
One thing we noticed in the system is that the HRTO would usually be connected to issues with the master node. In some cases, the selected master would become too busy to be able to handle the alignment process which would cause the historical read alignment to either take longer or fail altogether. In order to minimize this problem we now carefully select a daemon to be the master, and make sure nothing else is attached to it.
In general, the master daemon is configured with OSPL_MASTER_PRIORITY=201 and the other daemons are set with OSPL_MASTER_PRIORITY=5 or OSPL_MASTER_PRIORITY=10.
To ensure the single process nodes will not attempt to become masters we recommend setting OSPL_MASTER_PRIORITY=0.
5.5 Namespace alignee
The durability service on all nodes are designed to store historical data for all applications in the system. Nevertheless, one can anticipate that this behavior would not scale for large systems. In fact, we have observed problems with this procedure in our systems as single process nodes are simply not capable of keeping up with the entire system traffic.
DDS allows one to configure this behavior on the durability services by means of the alignee policy.
By default alignee=Initial which would cause the durability service to store historical data for all (non-volatile) topics.
In order to reduce the strain in the system we switched to alignee=Lazy configuration on daemons and, most importantly, single process nodes.
That means the durability service on those nodes will only store data from the topics that are registered in them, substantially reducing the network traffic and computing load on the applications.
5.5.1 Lazy master
One caveat we faced when configuring all systems with alignee=Lazy is that a Lazy master would not store historical data for systems not attached to it.
At the same time, we also configured a dedicated master, with no systems attached to it.
Ultimately, the master node ignores all topics causing requests for historical data to timeout and fail.
To resolve this issue we must make sure to configure the master node with alignee=Initial.
For operations we may want to have backup master nodes with alignee=Initial in case the master node crashes.
5.6 Nublado
After the initial test it seemed like the Jupyter notebooks from the nublado platform would also have to transition to using the DDS shared memory mode, and therefore, the licensed version of OpenSplice. During the tests of the features introduced above it was possible to demonstrate that the single process mode is now capable of joining a domain and communicating with the CSCs in the system. In particular, the feature that seems to allow the use of single process mode is the introduction of the DDS data partitioning.
Although single process from notebooks can work with a large scale system deployed with shared memory, we did notice some small issues. Probably the most critical one is that creating a salobj Remote soon after creating a Domain will, in most cases, cause a HRTO problem. After inspecting the DDS logs it was possible to track this issue to trying to start DDS readers while the domain was still aligning with the other systems. Since this process is handled by the DDS daemon, using the shared memory more should help avoid such problems.
In any case, the fact that we can operate with single process mode from nublado should take the pressure from having to implement shared memory in a short timeframe.
6 Conclusions and Future Work
From the tests executed at NCSA and described in previous sections, it is clear that the Vera Rubin Observatory Control system has grown large enough to be treated as a large scale system. The immediate impact of this growth is that we are no longer able to run the system reliably with single process mode configuration. The most immediate solution is to switch to shared memory mode, which is the recommended configuration for a large scale system.
Further investigation with the full Observatory System shows that the system also requires a non-standard configuration for the daemons, with expanded memory allocations and additional or changed parameters. A new data partitioning schema was also implemented, which allows ancillary systems (like nublado notebook servers and, most likely, other embedded components) to operate reliably.
Nevertheless, this new operational mode impacts considerably how we deploy the system. To begin with, we now must now build all the components with a licensed version of OpenSplice, which requires them to be privately hosted, rather than publicly accessible (over docker hub for instance). Furthermore, we must configure all components to be able to connect to an ospl daemon, that is in charge of running the OpenSplice DDS services.
From the experiments executed at NCSA it was also possible to identify a potential useful tool to monitor the state of a system. The health of the DDS daemons and single process applications alike can be accessed by means of the DDS builtin topics. These topics are actually accessible to applications in general and can be setup to monitor those topics. It would be extremely helpful to develop a tool to subscribe to and monitor these topics and, therefore, provide information about the general health of the system as a whole.
Finally, we must continue to expand the number of components deployed in a test environment as closely as possible to what the production (e.g. summit) environment will look like. This will allow us to determine whether the configuration we propose will result is a stable system or if further changes are needed.
7 Appendix
7.2 Standard OpenSplice Configuration
Standard, single process mode OpenSplice configuration. This is an example of an original file used to configure all applications.
<OpenSplice>
    <Domain>
        <Name>ospl_sp_ddsi</Name>
        <Id>0</Id>
        <SingleProcess>true</SingleProcess>
        <Description>Stand-alone 'single-process' deployment and standard DDSI networking.</Description>
        <Service name="ddsi2">
            <Command>ddsi2</Command>
        </Service>
        <Service name="durability">
            <Command>durability</Command>
        </Service>
        <Service enabled="false" name="cmsoap">
            <Command>cmsoap</Command>
        </Service>
    </Domain>
    <DDSI2Service name="ddsi2">
        <General>
            <NetworkInterfaceAddress>AUTO</NetworkInterfaceAddress>
            <AllowMulticast>true</AllowMulticast>
            <EnableMulticastLoopback>true</EnableMulticastLoopback>
            <CoexistWithNativeNetworking>false</CoexistWithNativeNetworking>
        </General>
        <Compatibility>
            <!-- see the release notes and/or the OpenSplice configurator on DDSI interoperability -->
            <StandardsConformance>lax</StandardsConformance>
            <!-- the following one is necessary only for TwinOaks CoreDX DDS compatibility -->
            <!-- <ExplicitlyPublishQosSetToDefault>true</ExplicitlyPublishQosSetToDefault> -->
        </Compatibility>
        <Discovery>
           <ParticipantIndex>none</ParticipantIndex>
        </Discovery>
     </DDSI2Service>
    <DurabilityService name="durability">
        <Network>
            <Alignment>
                <TimeAlignment>false</TimeAlignment>
                <RequestCombinePeriod>
                    <Initial>2.5</Initial>
                    <Operational>0.1</Operational>
                </RequestCombinePeriod>
            </Alignment>
            <WaitForAttachment maxWaitCount="100">
                <ServiceName>ddsi2</ServiceName>
            </WaitForAttachment>
        </Network>
        <NameSpaces>
            <NameSpace name="defaultNamespace">
                <Partition>*</Partition>
            </NameSpace>
            <Policy alignee="Initial"
                    aligner="true"
                    durability="Durable"
                    masterPriority="${OSPL_MASTER_PRIORITY:-1}"
                    nameSpace="defaultNamespace"/>
        </NameSpaces>
    </DurabilityService>
    <TunerService name="cmsoap">
        <Server>
            <PortNr>Auto</PortNr>
        </Server>
    </TunerService>
</OpenSplice>